


SAMHSA register, November 16, 2026
How far is treatment from each Illinois county?
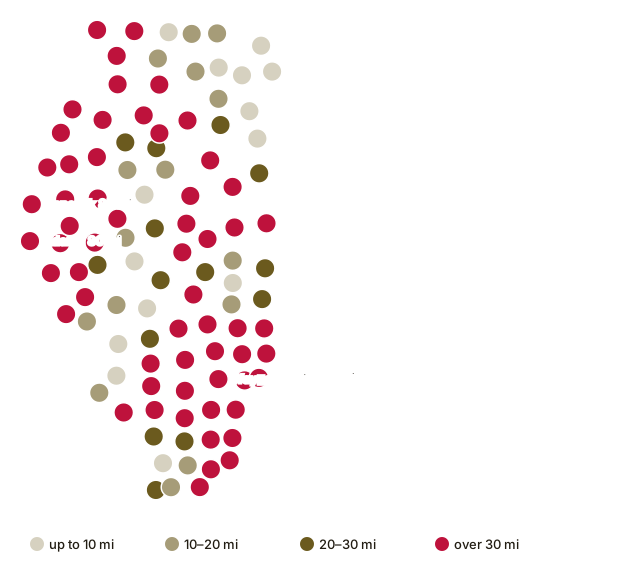
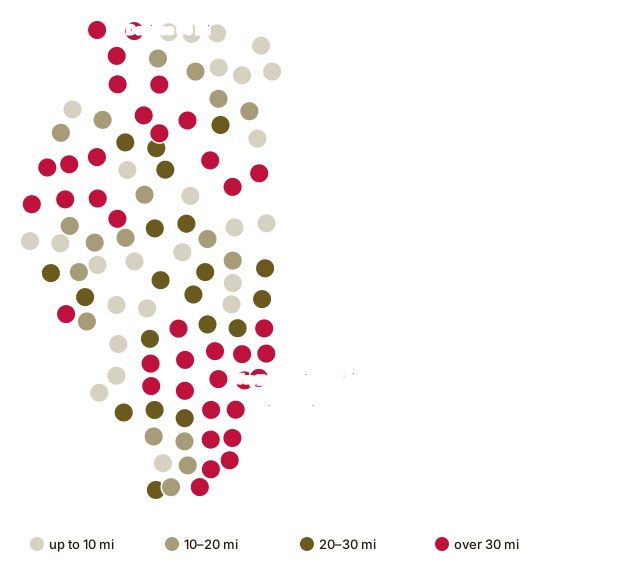
The map starts at the center of each of the 102 counties in Illinois. From each one, we counted the miles to three kinds of care: detox, a live-in program and a medicine clinic. 59 counties, with 1,902,030 residents, sit more than 30 miles from the closest detox. 18 counties lack any treatment site.
Keep two things at hand for the call: the ZIP code and the insurance card, whether the caller's own or a family member's. A referral partner answers this paid line; programs in this directory do not.
Every county, 102 in all
Counties appear in order of distance to the nearest detox, farthest first. The miles are measured in a straight line; the drive itself runs longer.
| County | Population 2024 | Facilities within county lines | Detox, mi | Residential, mi | MAT, mi |
|---|---|---|---|---|---|
| Hancock County | 17,008 | 2 | 84.6 | 34.3 | 3.0 |
| Adams County | 64,109 | 7 | 79.9 | 9.6 | 9.6 |
| Edwards County | 5,984 | 1 | 74.7 | 69.0 | 15.2 |
| Wabash County | 10,979 | 1 | 74.6 | 70.3 | 4.3 |
| Wayne County | 15,928 | 1 | 74.5 | 64.8 | 36.0 |
| Rock Island County | 142,731 | 8 | 73.8 | 7.4 | 0.6 |
| White County | 13,395 | 1 | 72.1 | 61.2 | 32.0 |
| Henderson County | 6,048 | 1 | 70.6 | 42.9 | 8.1 |
| Mercer County | 15,292 | 0 | 69.3 | 14.8 | 14.8 |
| Pike County | 14,258 | 2 | 62.6 | 25.4 | 32.5 |
| Jo Daviess County | 21,528 | 1 | 60.6 | 58.5 | 12.4 |
| Jefferson County | 36,107 | 4 | 59.7 | 43.2 | 27.9 |
| Gallatin County | 4,690 | 1 | 59.3 | 53.1 | 38.9 |
| Lawrence County | 14,801 | 1 | 58.7 | 56.2 | 5.2 |
| McDonough County | 26,662 | 2 | 58.7 | 33.2 | 1.5 |
| Marion County | 36,437 | 3 | 58.3 | 56.5 | 51.9 |
| Hamilton County | 7,818 | 0 | 57.3 | 44.1 | 25.4 |
| Brown County | 6,307 | 1 | 56.6 | 1.4 | 31.6 |
| Whiteside County | 54,657 | 2 | 56.0 | 31.3 | 23.5 |
| Schuyler County | 6,750 | 1 | 55.0 | 14.6 | 20.7 |
| Warren County | 16,217 | 2 | 54.4 | 35.3 | 5.3 |
| Richland County | 15,362 | 1 | 54.2 | 48.7 | 24.1 |
| Clay County | 12,821 | 1 | 54.0 | 45.7 | 44.8 |
| Hardin County | 3,550 | 1 | 53.7 | 52.7 | 35.0 |
| Vermilion County | 71,106 | 5 | 53.7 | 8.1 | 6.0 |
| Henry County | 48,177 | 1 | 53.2 | 17.2 | 21.3 |
| Carroll County | 15,444 | 1 | 46.9 | 45.4 | 2.5 |
| Bureau County | 32,486 | 1 | 46.6 | 43.4 | 22.7 |
| De Witt County | 15,319 | 1 | 46.5 | 22.3 | 4.9 |
| Champaign County | 212,374 | 6 | 44.7 | 2.8 | 2.6 |
| Perry County | 20,272 | 3 | 43.0 | 27.3 | 21.6 |
| Saline County | 22,826 | 0 | 42.9 | 35.7 | 21.6 |
| Piatt County | 16,628 | 1 | 41.8 | 19.2 | 18.0 |
| Scott County | 4,880 | 0 | 41.2 | 13.5 | 13.5 |
| LaSalle County | 108,390 | 5 | 41.1 | 42.1 | 3.0 |
| Ford County | 13,451 | 0 | 40.9 | 31.4 | 32.2 |
| Crawford County | 18,388 | 0 | 40.6 | 40.1 | 19.0 |
| Franklin County | 37,033 | 5 | 40.0 | 24.3 | 6.6 |
| Livingston County | 35,375 | 1 | 39.5 | 37.1 | 33.1 |
| Fayette County | 21,157 | 2 | 38.9 | 38.9 | 38.9 |
| Pope County | 3,703 | 1 | 38.6 | 38.6 | 19.3 |
| Effingham County | 34,602 | 2 | 37.8 | 28.3 | 28.3 |
| McLean County | 172,069 | 7 | 37.0 | 9.3 | 6.0 |
| Lee County | 33,544 | 4 | 36.4 | 36.2 | 17.8 |
| Knox County | 48,716 | 1 | 36.0 | 32.3 | 8.2 |
| Macon County | 100,737 | 5 | 35.8 | 1.3 | 0.9 |
| Fulton County | 32,510 | 1 | 35.1 | 35.1 | 26.5 |
| Massac County | 13,627 | 2 | 34.4 | 34.4 | 4.9 |
| Mason County | 12,543 | 0 | 34.1 | 33.3 | 29.5 |
| Putnam County | 5,633 | 0 | 33.9 | 33.8 | 13.5 |
| Randolph County | 29,903 | 2 | 33.8 | 27.7 | 8.6 |
| Shelby County | 20,542 | 2 | 33.8 | 26.0 | 26.0 |
| Jasper County | 9,092 | 1 | 33.7 | 28.3 | 28.3 |
| Washington County | 13,535 | 1 | 33.2 | 33.2 | 33.2 |
| Stephenson County | 43,088 | 2 | 33.1 | 30.8 | 4.2 |
| Greene County | 11,417 | 0 | 33.0 | 26.2 | 26.2 |
| Calhoun County | 4,224 | 0 | 31.9 | 31.9 | 31.9 |
| Cass County | 12,713 | 3 | 31.7 | 17.3 | 16.3 |
| Clinton County | 37,087 | 1 | 30.9 | 30.1 | 30.9 |
| Stark County | 5,272 | 0 | 29.8 | 23.8 | 23.8 |
| Bond County | 16,576 | 1 | 29.5 | 29.5 | 29.5 |
| Logan County | 27,518 | 2 | 27.8 | 26.9 | 1.1 |
| Edgar County | 16,398 | 1 | 26.5 | 26.5 | 26.5 |
| Morgan County | 32,618 | 2 | 26.0 | 2.2 | 1.5 |
| Moultrie County | 14,365 | 0 | 25.7 | 22.6 | 22.6 |
| Iroquois County | 26,067 | 1 | 25.6 | 33.2 | 25.6 |
| Williamson County | 67,064 | 7 | 24.8 | 14.6 | 0.5 |
| Clark County | 15,076 | 1 | 23.6 | 23.6 | 23.6 |
| Christian County | 33,247 | 2 | 23.5 | 23.5 | 23.4 |
| Jackson County | 53,199 | 5 | 23.1 | 11.3 | 3.3 |
| Marshall County | 11,552 | 0 | 22.1 | 22.9 | 22.1 |
| Grundy County | 53,835 | 1 | 21.4 | 23.0 | 21.1 |
| Alexander County | 4,594 | 1 | 20.7 | 20.7 | 20.7 |
| Monroe County | 34,969 | 2 | 20.0 | 5.9 | 11.9 |
| Johnson County | 13,320 | 4 | 19.8 | 19.8 | 2.6 |
| Ogle County | 51,345 | 3 | 19.8 | 19.1 | 14.8 |
| Douglas County | 19,824 | 0 | 19.0 | 19.0 | 19.0 |
| DeKalb County | 101,335 | 4 | 18.7 | 18.7 | 15.7 |
| Pulaski County | 4,879 | 0 | 18.7 | 18.7 | 18.7 |
| Menard County | 11,963 | 0 | 18.0 | 17.3 | 17.3 |
| McHenry County | 315,959 | 8 | 17.8 | 0.6 | 0.6 |
| Kendall County | 143,171 | 1 | 16.0 | 14.6 | 5.2 |
| Jersey County | 21,150 | 0 | 15.6 | 15.6 | 15.6 |
| Cumberland County | 10,305 | 1 | 15.5 | 9.2 | 9.2 |
| Macoupin County | 43,895 | 3 | 15.0 | 2.2 | 2.0 |
| Woodford County | 38,290 | 0 | 14.7 | 21.7 | 14.7 |
| Boone County | 53,313 | 2 | 12.3 | 7.0 | 4.6 |
| Peoria County | 179,630 | 13 | 10.8 | 6.9 | 6.9 |
| Montgomery County | 27,615 | 2 | 9.7 | 9.7 | 9.7 |
| Will County | 708,583 | 22 | 9.7 | 10.4 | 8.2 |
| Tazewell County | 129,821 | 4 | 9.6 | 13.4 | 9.6 |
| Winnebago County | 283,790 | 12 | 9.4 | 6.7 | 4.9 |
| Madison County | 263,017 | 6 | 5.3 | 7.8 | 5.3 |
| St. Clair County | 251,149 | 9 | 5.1 | 5.1 | 5.1 |
| Lake County | 718,604 | 25 | 4.0 | 4.6 | 2.4 |
| DuPage County | 937,142 | 44 | 2.9 | 2.9 | 0.5 |
| Coles County | 46,423 | 8 | 2.6 | 2.6 | 2.6 |
| Kane County | 520,997 | 19 | 2.3 | 2.3 | 2.3 |
| Sangamon County | 194,345 | 9 | 2.1 | 2.1 | 2.1 |
| Kankakee County | 106,410 | 7 | 1.4 | 6.8 | 1.4 |
| Union County | 16,886 | 4 | 1.1 | 1.1 | 1.1 |
| Cook County | 5,182,617 | 289 | 0.6 | 0.8 | 0.5 |
No clear starting point?
Undecided on a program? A caller can reach any listed program directly or use the referral line below instead.
A referral partner answers this paid line; programs in this directory do not.
Method
Facility list: each Illinois listing on SAMHSA FindTreatment.gov whose record shows detox or substance use treatment, taken from the snapshot of November 16, 2026. County center points: the 2024 Gazetteer published by the U.S. Census Bureau. Population figures: Census Bureau estimates for 2024. Facilities fall into counties by ZIP code, matched through the Census file that links ZCTAs to counties. Distance runs in great-circle miles, from the internal point of each county to the coordinates that the facility lists; for a listing without SAMHSA coordinates, the Census Geocoder works from the street address, or uses the middle of the ZIP code if the listing has no street. Under MAT, the count includes certified opioid treatment programs (OTP). Anyone may reuse these figures with a link back to this page.